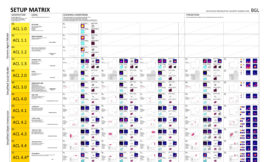
We aim at bridging the gap between pedestrian simulations on one side, and the world of CAD (Maya, Revit, Rhino/Grasshopper, CATIA etc.). The goal is to take a pedestrian simulation, for instance from Unity, and to learn about the interaction between people and their environment. Thus, we want to answer the question: how can the output of the simulations be made available for the designer? We are going to propose an answer that allows to draw the density of pedestrian activity, as generated in a simulation, onto the design canvas in an adaptive manner.
Buildings are static, data are dynamic …. how can we bring these two together? We convert people’s tracks and behaviors into machine-readable form, in such a way that we can use this form for machine learning, apply the learned information to predict how people will respond to a new design.
The purpose of this is, for instance, to predict pedestrian densities from 2D plans, and to evaluate empirical data.
Conceptually, the method consists of two independent steps.
First, one fits the observed locations to user-supplied input functions (aka “fitting step”). This first step is already of importance in itself, independently of the second.
Afterwards, one generalizes away from the initial scene, to a modified scene with a possible design intervention (aka “design step”).
To describe the prediction method in a nutshell, the notion of point pattern from spatial statistics proves useful.
What is a point pattern? Basically, nothing else than a point cloud; in other words, any kind of data that can be represented by a table with an x- and a y-column. Each point can stand for a person at some point in time, or an event such as a conversation onset. Ultimately, a designer might be interested in maximizing the number of predicted encounters in a simulated scene, for instance. However, we can think of many other examples in which pedestrian behavior leads to data coming in the form of a point cloud.
Such a point cloud can become arbitrarily complex, of course. One can now statically estimate the density of this point process, resulting in an image that resembles but that is not our goal because it does not allow for any inference or “learning”. In fact, merely estimating a density is a graphics processing step which as such does not entail any insights or predictions. Instead, we aim at analyzing the point cloud in such a way that it allows for making statements about the nature of the process.
In architectural terms, we might be interested in questions such as: is the accumulation of points influence due to the proximity of a particular attractor? what is the influence exerted by a particular design object? etc.
Since our goal is to predict what happens on the simulation when we move some of the most important spatial features, let us first demonstrate the agents’ movement as their environment changes. So, let us now assume the point cloud is being “influenced” by spatial features, such as, for instance, a moving attractor:
In broad terms, the goal of the project is to take the pedestrian density depicted in just the first figure out of the preceding four, and predict it for the remaining three.
What is a feature?
For this, we need the prediction to be based on what we call a feature. A feature is a user-supplied “explanatory” spatial function. It can be thought of as an grey-scale image, overlaid onto the 2d rectangle representing the scene’s bounding box in plane view. A typical function could represent the distance to a point of interest such as the central table in a meeting room. Thought of as an image, it consists of radial isolines around the table, getting darker and darker farther away from it.
Now, prediction is done by writing an observed point pattern as a linear combination, which is just another word for weighted overlay, of such features.
If we know how these functions generalize to other designs, we will be in a position to also carry the linear combination to the new design.
And that new overlay is just the predicted pattern! This describes the method in a nutshell.


